Data Analysis and Visualization in Matlab
Are you looking to harness the power of data analysis and visualization using Matlab? In this blog post, we will delve into the world of data analysis and visualization, specifically focusing on how to use Matlab for these tasks.
First, we will provide an overview of data analysis in Matlab, exploring its capabilities and benefits. Next, we will discuss the process of importing and preprocessing data in Matlab, highlighting best practices and useful tools. Then, we will dive into exploratory data analysis and visualization, showcasing the various techniques and visualizations that Matlab offers.
Following that, we will shift our attention to statistical analysis and modeling in Matlab, providing insights into how to perform these tasks effectively. Lastly, we will explore advanced techniques for data analysis and visualization in Matlab, delving into more complex methods and tools.
Whether you are new to Matlab or looking to expand your knowledge, this blog post will provide valuable insights and practical tips for leveraging Matlab for data analysis and visualization. Stay tuned for an in-depth exploration of these topics!
Introduction to Data Analysis in Matlab
Data analysis is a crucial part of the research and decision-making process in various fields including engineering, science, and business. Matlab is a powerful tool that provides a wide range of functions for data analysis, making it a popular choice among researchers and professionals. Whether you are a beginner or an experienced user, understanding the basics of data analysis in Matlab is essential for effective data interpretation and visualization.
One of the key features of Matlab is its ability to handle large datasets and perform complex calculations with ease. The software allows users to import data from different sources such as spreadsheets, databases, and text files, making it a convenient tool for data preprocessing. Moreover, Matlab offers a variety of functions for data cleaning, transformation, and manipulation, which are essential steps in the data analysis process.
Once the data is imported and preprocessed, the next step is exploratory data analysis (EDA) and visualization. Matlab provides a range of tools for EDA, including statistical summaries, distribution plots, and correlation analysis. By visualizing the data, researchers can identify patterns, trends, and outliers, which are valuable insights for further analysis and decision-making.
Overall, understanding the basics of data analysis in Matlab is essential for researchers and professionals working with large and complex datasets. With its powerful functions for importing, preprocessing, visualization, and statistical analysis, Matlab provides a comprehensive platform for effective data analysis and interpretation.
Importing and Preprocessing Data in Matlab
When working on data analysis projects in Matlab, one of the first steps is importing the data into the software. This can be done from various file formats such as .csv, .xls, .txt, and more. Once the data is imported, preprocessing steps are necessary to ensure that the data is clean and ready for analysis. This involves handling missing values, removing duplicates, and dealing with outliers.
One of the methods for importing data is by using the readtable function in Matlab. This function allows users to read tabular data from a file or from the clipboard. It provides options for handling missing data, specifying variable types, and more. Moreover, the readmatrix function can be used to read numeric or text data from a file into a matrix.
After importing the data, it is important to preprocess it to handle any inconsistencies or errors. This can be done using functions such as fillmissing, rmmissing, and unique. These functions help in filling missing values, removing rows with missing values, and identifying unique elements in the data respectively.
Overall, the process of importing and preprocessing data in Matlab is essential for data analysis projects. It sets the foundation for further exploration, analysis, and visualization of the data.
Exploratory Data Analysis and Visualization in Matlab
Exploratory Data Analysis (EDA) is a crucial process in data analysis that involves exploring and understanding the underlying patterns and relationships within the data. In Matlab, EDA is performed using various statistical and visualization techniques to gain insights into the data before applying more advanced modeling techniques.
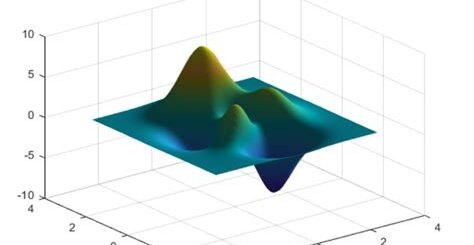
One of the key steps in EDA is data visualization, which allows for the exploration of relationships and patterns within the data through the use of plots and charts. In Matlab, there are numerous functions and tools available for creating visualizations such as scatter plots, histograms, box plots, and heatmaps.
Another important aspect of EDA in Matlab is the use of descriptive statistics to summarize the main characteristics of the data. This includes measures such as mean, median, standard deviation, and skewness, which provide valuable insights into the distribution and variability of the data.
Overall, EDA and visualization in Matlab play a critical role in the initial stages of data analysis by allowing analysts to gain a deeper understanding of the dataset and identify potential patterns and trends that may guide further analysis and modeling.
Statistical Analysis and Modeling in Matlab
When it comes to statistical analysis and modeling in Matlab, there are a plethora of tools and functions available to help you make sense of your data. Whether you’re looking to perform hypothesis testing, regression analysis, or build predictive models, Matlab has the capabilities to support your data analysis needs.
One of the key features that sets Matlab apart is its extensive library of statistical functions. From basic summary statistics like mean, median, and standard deviation to more advanced techniques such as ANOVA and time series analysis, Matlab provides a comprehensive set of tools for analyzing and modeling your data.
Another advantage of using Matlab for statistical analysis and modeling is its integration with machine learning algorithms. With the built-in machine learning toolbox, you can easily apply clustering, classification, and regression algorithms to your data, allowing you to uncover hidden patterns and make predictions based on your data.
Whether you’re a beginner or an advanced user, Matlab offers a range of resources to support your statistical analysis and modeling needs. From online documentation and tutorials to community forums and support from MathWorks, the creators of Matlab, you can find the help you need to effectively analyze and model your data.
Advanced Techniques for Data Analysis and Visualization in Matlab
Once you have mastered the basics of data analysis and visualization in Matlab, it’s time to explore some more advanced techniques that can take your skills to the next level. In this blog post, we will delve into some of the more sophisticated methods and tools that Matlab has to offer for analyzing and visualizing data.
One of the first advanced techniques that we will cover is the use of machine learning algorithms for data analysis. Matlab has a comprehensive set of built-in functions for machine learning, including support for classification, regression, clustering, and dimensionality reduction. By leveraging these tools, you can gain deeper insights into your data and make more accurate predictions.
Another advanced technique that we will explore is interactive visualization. While Matlab offers a range of static plotting functions, it also provides powerful interactive visualization tools that allow you to create dynamic and responsive visualizations. These tools can be particularly useful for exploring complex datasets and presenting your findings in an engaging and interactive way.
In addition to machine learning and interactive visualization, we will also discuss advanced statistical analysis techniques in Matlab. This includes methods for dealing with missing data, handling outliers, and performing advanced hypothesis testing. By mastering these techniques, you can ensure that your data analysis is rigorous and reliable.


